Table of Contents
概要
今回は、react-chartjs-2を使用して、円グラフと縦棒グラフを作成しました。また描画するグラフの数が増えてきたのでTanStackRouterを使ってルーティングできるようにしました。
注意:まだお読みで無い方は、react-chartjs-2の使い方①②の記事もご覧ください。


Install
前回までの記事のコマンドに加えて次のコマンドを実行して下さい。私はViteを利用しているのでTanstack Routerに加えてfile-based routingにするためのvite pluginをinstallしています。環境により異なるので合わせて下さい。
npm install @tanstack/react-router
npm install @tanstack/router-vite-plugin
npm install @tanstack/router-devtools
TanStackRouterとは
TanStackRouterとはJS、TS向けに用意されたページの遷移やルートの定義が容易で、状態管理やデータ取得の統合がスムーズにできるルーティングライブラリです。今回はディレクトリ構造に基づいてルートを自動生成できるFile-based routingを採用しました。
グラフ表示(縦棒グラフと円グラフ)
まず単純な縦棒グラフを表示ました。コンポーネントは次のとおりです。
import { useRef } from 'react'
import {
  Chart as ChartJS,
  CategoryScale,
  BarElement,
  Title,
  Tooltip,
  Legend,
  ChartOptions,
  ChartData,
} from 'chart.js/auto'
import { Bar } from 'react-chartjs-2'
import zoomPlugin from 'chartjs-plugin-zoom'
import { ZoomPluginOptions } from 'chartjs-plugin-zoom/types/options'

ChartJS.register(CategoryScale, BarElement, Title, Tooltip, Legend, zoomPlugin)
interface BargraphProps {
  graphData: ChartData<'bar'>
  title: string
  xtext: string
  ytext: string
  className: string
}
export default function Bargraph({
  graphData,
  title,
  xtext,
  ytext,
  className,
}: BargraphProps) {
  const chartRef = useRef<ChartJS<'bar', number[], string>>(null)

  const onResetZoom = () => {
    chartRef?.current?.resetZoom()
  }
  const zoomOptions: Partial<ZoomPluginOptions> = {
    zoom: {
      wheel: {
        enabled: true,
      },
      pinch: {
        enabled: true,
      },
      mode: 'x',
    },
    pan: {
      enabled: true,
      mode: 'x',
    },
  }

  const options: ChartOptions<'bar'> = {
    responsive: true,
    scales: {
      x: {
        display: true,
        title: {
          display: true,
          text: xtext,
        },
      },
      y: {
        title: {
          display: true,
          text: ytext,
        },
      },
    },
    plugins: {
      legend: {
        position: 'top',
      },
      title: {
        display: true,
        text: title,
      },
      zoom: zoomOptions,
    },
    maintainAspectRatio: false,
  }

  return (
    <>
      <Bar
        className={className}
        ref={chartRef}
        data={graphData}
        options={options}
      />
      <button onClick={onResetZoom}>zoom reset</button>
    </>
  )
}
import { useRef } from 'react'
import {
  Chart as ChartJS,
  CategoryScale,
  ArcElement,
  Title,
  Tooltip,
  Legend,
  ChartOptions,
  ChartData,
} from 'chart.js/auto'
import { Pie } from 'react-chartjs-2'
import zoomPlugin from 'chartjs-plugin-zoom'

ChartJS.register(CategoryScale, ArcElement, Title, Tooltip, Legend, zoomPlugin)
interface PiegraphProps {
  graphData: ChartData<'pie'>
  title: string
  className: string
}
export default function Piegraph({
  graphData,
  title,
  className,
}: PiegraphProps) {
  const chartRef = useRef<ChartJS<'pie', number[], string>>(null)

  const options: ChartOptions<'pie'> = {
    responsive: true,
    plugins: {
      legend: {
        position: 'top',
      },
      title: {
        display: true,
        text: title,
      },
    },
    maintainAspectRatio: false,
  }

  return (
    <Pie
      className={className}
      ref={chartRef}
      data={graphData}
      options={options}
    />
  )
}
コードの説明その1
importとChartJS.register()
import { useRef } from 'react'
import {
  Chart as ChartJS,
  CategoryScale,
  BarElement,
  Title,
  Tooltip,
  Legend,
  ChartOptions,
  ChartData,
} from 'chart.js/auto'
import { Bar } from 'react-chartjs-2'
import zoomPlugin from 'chartjs-plugin-zoom'
import { ZoomPluginOptions } from 'chartjs-plugin-zoom/types/options'

ChartJS.register(CategoryScale, BarElement, Title, Tooltip, Legend, zoomPlugin)
import { useRef } from 'react'
import {
  Chart as ChartJS,
  CategoryScale,
  ArcElement,
  Title,
  Tooltip,
  Legend,
  ChartOptions,
  ChartData,
} from 'chart.js/auto'
import { Pie } from 'react-chartjs-2'
import zoomPlugin from 'chartjs-plugin-zoom'

ChartJS.register(CategoryScale, ArcElement, Title, Tooltip, Legend, zoomPlugin)
- ①、②の記事と比較すると、
react-chartjs-2からのインポート内容が〇〇Eelementから、BarElement、ArcElementに変わりました。 react-chartjs-2からのインポート内容がBar,Pieに変わりました。- import元が
chart.jsからchart.js/autoに変わりました。この理由については後ほど説明します。
Propsと操作関数、各種オプションやコンポーネントのレンダリング
interface BargraphProps {
  graphData: ChartData<'bar'>
  title: string
  xtext: string
  ytext: string
  className: string
}
export default function Bargraph({
  graphData,
  title,
  xtext,
  ytext,
  className,
}: BargraphProps) {
  const chartRef = useRef<ChartJS<'bar', number[], string>>(null)

  const onResetZoom = () => {
    chartRef?.current?.resetZoom()
  }
  const zoomOptions: Partial<ZoomPluginOptions> = {
    zoom: {
      wheel: {
        enabled: true,
      },
      pinch: {
        enabled: true,
      },
      mode: 'x',
    },
    pan: {
      enabled: true,
      mode: 'x',
    },
  }

  const options: ChartOptions<'bar'> = {
    responsive: true,
    scales: {
      x: {
        display: true,
        title: {
          display: true,
          text: xtext,
        },
      },
      y: {
        title: {
          display: true,
          text: ytext,
        },
      },
    },
    plugins: {
      legend: {
        position: 'top',
      },
      title: {
        display: true,
        text: title,
      },
      zoom: zoomOptions,
    },
    maintainAspectRatio: false,
  }

  return (
    <>
      <Bar
        className={className}
        ref={chartRef}
        data={graphData}
        options={options}
      />
      <button onClick={onResetZoom}>zoom reset</button>
    </>
  )
}
interface PiegraphProps {
  graphData: ChartData<'pie'>
  title: string
  className: string
}
export default function Piegraph({
  graphData,
  title,
  className,
}: PiegraphProps) {
  const chartRef = useRef<ChartJS<'pie', number[], string>>(null)

  const options: ChartOptions<'pie'> = {
    responsive: true,
    plugins: {
      legend: {
        position: 'top',
      },
      title: {
        display: true,
        text: title,
      },
    },
    maintainAspectRatio: false,
  }

  return (
    <Pie
      className={className}
      ref={chartRef}
      data={graphData}
      options={options}
    />
  )
}
- 型定義などで少々異なる点はありますが、基本的には①、②の記事で説明したものと同じです。プロパティなどについては①の記事をご確認ください。
- 円グラフに関してはx,y軸はなく、また拡大縮小することもないため
optionからその部分を削除しています。
コンポーネントの使い方
<Bargraph
            graphData={sampleBargraphData2}
            title={'sample'}
            xtext={'xtext'}
            ytext={'ytext'}
            className={''}
          />
<Piegraph
            graphData={samplePiegraphData2}
            title={'sample'}
            className={''}
          />
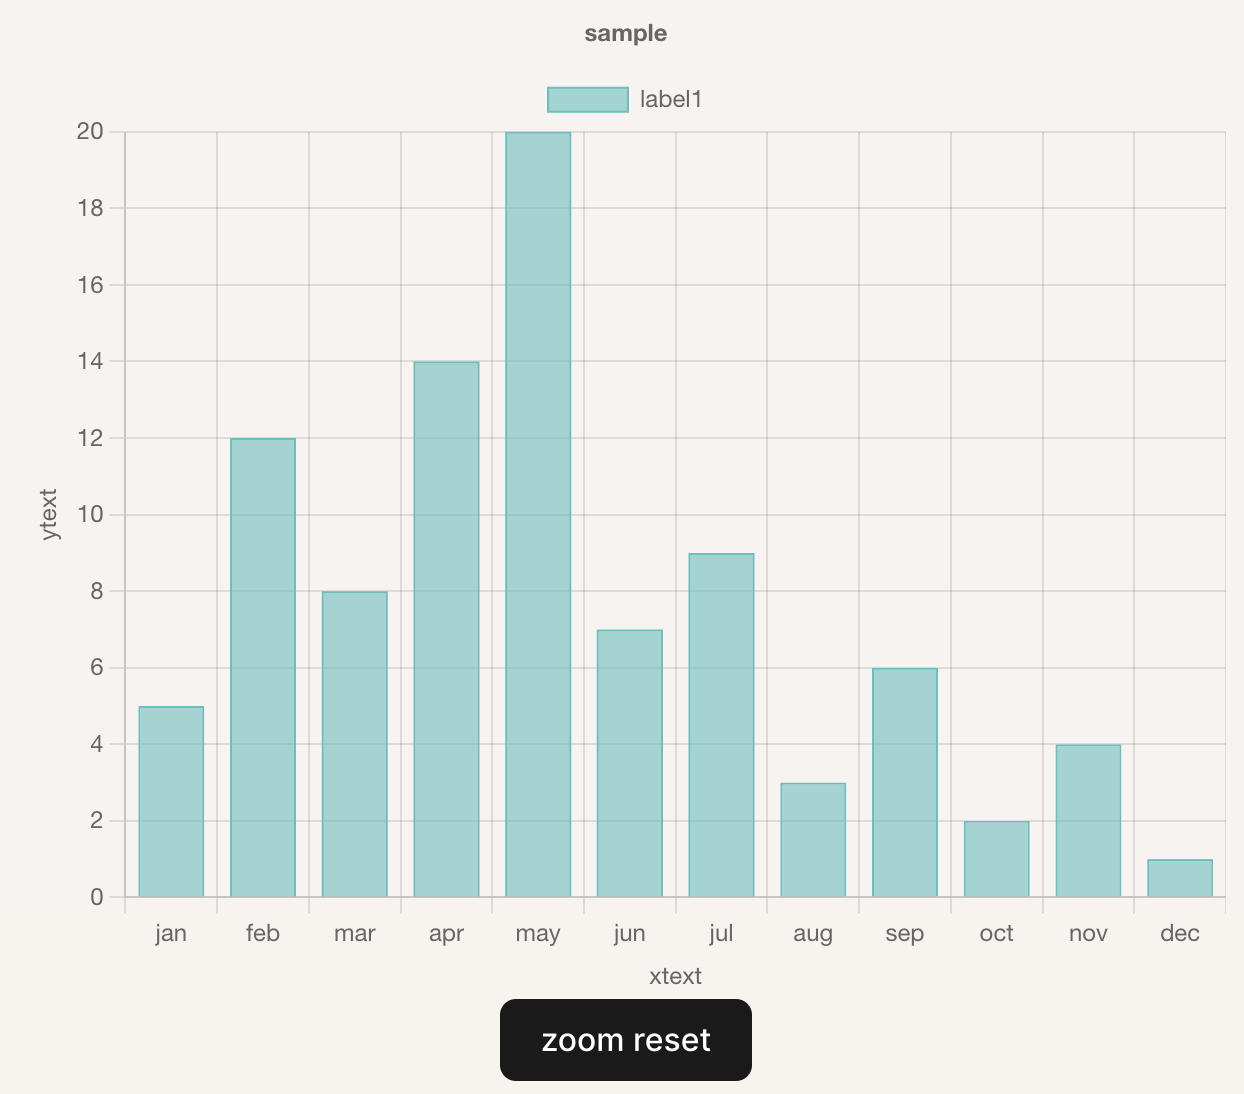
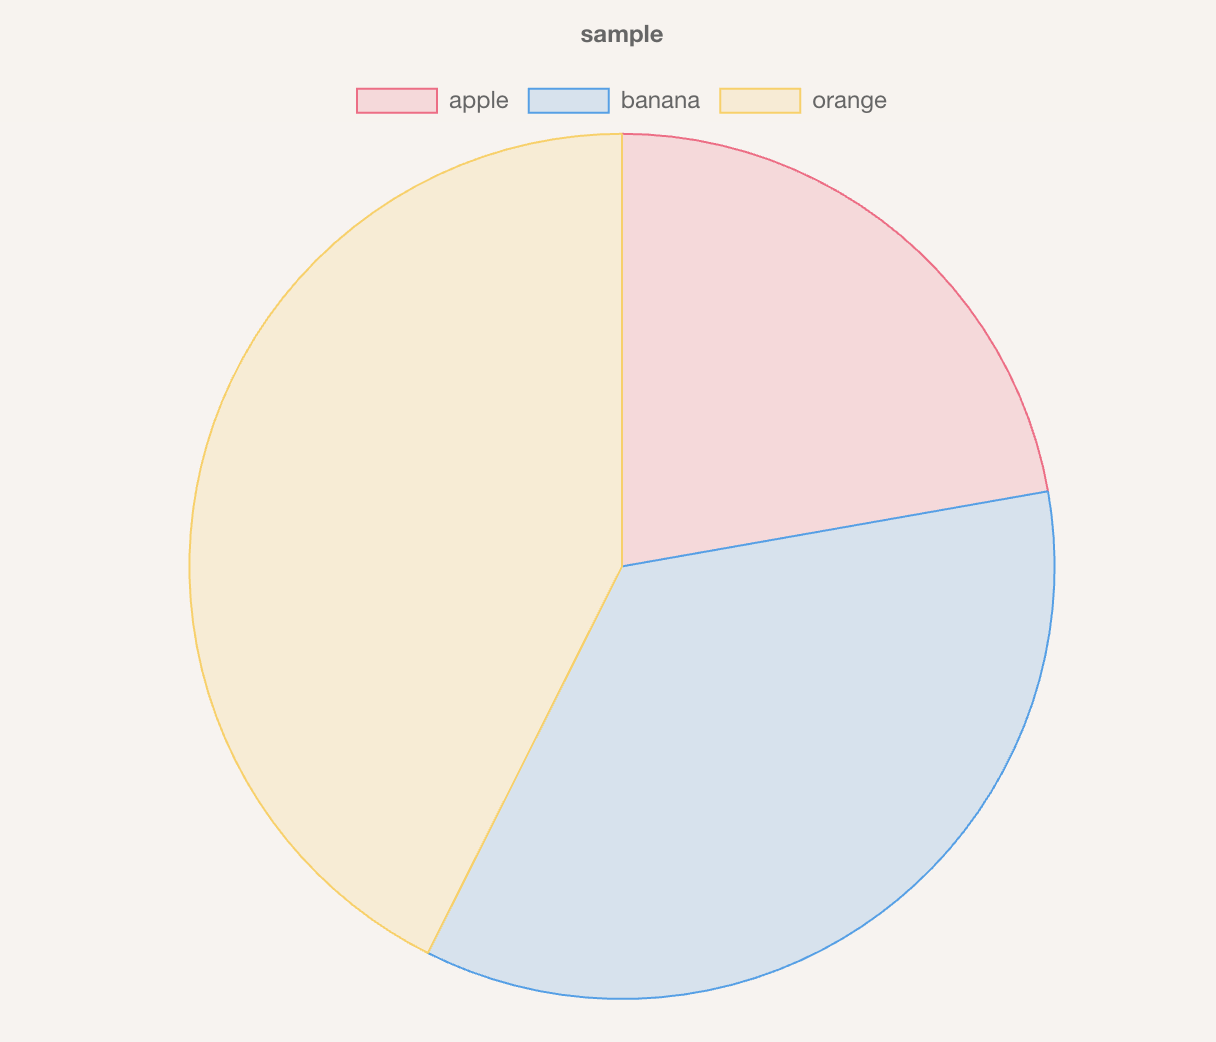
これらのコンポーネントを使うことで次のようなグラフを描画できます。


ルーティングの設定
①、②、③で作成したグラフを並べて配置していたためグラフが見づらくなってしまいました。そこでTanStackRouterを用いてグラフを別ページに分けてルーティングを設定しました。
vite.config.tsへの追加
公式ドキュメントの記述通り、vite.config.tsへ設定を加えます。
import { defineConfig } from 'vite'
import react from '@vitejs/plugin-react'
import { TanStackRouterVite } from '@tanstack/router-vite-plugin'

export default defineConfig({
  plugins: [
    react(),
    TanStackRouterVite(),
  ],
})
main.tsxの修正
TanStackRouterを組み込むための次のように修正します。
import React from 'react'
import ReactDOM from 'react-dom/client'
import { routeTree } from './routeTree.gen'
import './app.css'
import './index.css'
import { RouterProvider, createRouter } from '@tanstack/react-router'
const router = createRouter({ routeTree: routeTree })

declare module '@tanstack/react-router' {
  interface Register {
    router: typeof router
  }
}

function App() {
  return <RouterProvider router={router} />
}

export default App
ReactDOM.createRoot(document.getElementById('root')!).render(
  <React.StrictMode>
    <RouterProvider router={router} />
  </React.StrictMode>
)
__root.tsxの追加
rootとなるファイルをroutesディレクトリの配下に配置します。
import { createRootRoute, Outlet } from '@tanstack/react-router'
import { TanStackRouterDevtools } from '@tanstack/router-devtools'

export const Route = createRootRoute({
  component: () => (
    <>
      <Outlet />
      <TanStackRouterDevtools />
    </>
  ),
})
import元の変更
import 〇〇 from ‘chart.js’をimport 〇〇 from ‘chart.js/auto’に変更します。理由としてViteはESM(ECMAScript Modules)をベースにしていて、Rollupを使ってモジュールをバンドルします。しかし、chart.jsをそのままインポートすると、必要な要素(スケールやエレメント)が自動的に登録されないため、グラフが正しく描画されない事があります。
chart.js/autoを使うと、Chart.jsの全ての必要な機能が自動で登録されるため、ViteやRollupでも問題なく動作します。これにより、グラフの表示が簡単になり、ビルド時のエラーを避けることができます。
参考にした記事
Isse Teruhi