
Table of Contents
techブログがJAMStack化して初めてのブログです。凄く書きやすい
pprofとは
GoのProfilerで標準パッケージの一つです
わりとすんなり使えるのに高機能なので簡単に使用方法を書いていきます
今回は 「runtime/pprof」を利用する場合の方法を記述します
runtime/pprof
まずプロファイリングデータをドキュメントのexampleを参考に取得します
下記コードの場合、「// ... rest of the program ...」部分のコードのプロファイリングデータを作成します
var cpuprofile = flag.String("cpuprofile", "", "write cpu profile to `file`")
var memprofile = flag.String("memprofile", "", "write memory profile to `file`")

func main() {
    flag.Parse()
    if *cpuprofile != "" {
        f, err := os.Create(*cpuprofile)
        if err != nil {
            log.Fatal("could not create CPU profile: ", err)
        }
        defer f.Close()
        if err := pprof.StartCPUProfile(f); err != nil {
            log.Fatal("could not start CPU profile: ", err)
        }
        defer pprof.StopCPUProfile()
    }

    // ... rest of the program ...

    if *memprofile != "" {
        f, err := os.Create(*memprofile)
        if err != nil {
            log.Fatal("could not create memory profile: ", err)
        }
        defer f.Close()
        runtime.GC() // get up-to-date statistics
        if err := pprof.WriteHeapProfile(f); err != nil {
            log.Fatal("could not write memory profile: ", err)
        }
    }
}
上記コードの場合は、cpuprofileを出したい時は 「-cpuprofile プロファイリングファイル名」
memoryを出したい時は「-memprofile プロファイリングファイル名」のオプションを付けて実行します
$ go build -o playground
$ ./playground -cpuprofile cpu_info
その後プロファイリングファイルをpprofのツールに読み込ませます
読み込ませ方は「go tool pprof 実行ファイル名 プロファイリングファイル名」です
$ go tool pprof playground cpu_info File: playground
Type: cpu
Time: Jul 7, 2019 at 7:34pm (JST)
Duration: 15.38s, Total samples = 36.01s (234.10%)
Entering interactive mode (type "help" for commands, "o" for options)対話式の画面になるので 「top 10」と入力してみます。
すると実行時間が長い順にソートされた状態で結果が出力されます。
(pprof) top 10
Showing nodes accounting for 34.39s, 95.50% of 36.01s total
Dropped 52 nodes (cum <= 0.18s)
Showing top 10 nodes out of 51
      flat  flat%   sum%        cum   cum%
    12.80s 35.55% 35.55%     12.83s 35.63%  runtime.pthread_cond_wait
     8.10s 22.49% 58.04%      8.10s 22.49%  runtime.pthread_cond_signal
     4.82s 13.39% 71.42%      4.82s 13.39%  runtime.(*semaRoot).queue
     3.83s 10.64% 82.06%      3.84s 10.66%  runtime.usleep
     3.23s  8.97% 91.03%      3.50s  9.72%  syscall.syscall
     0.86s  2.39% 93.42%      0.86s  2.39%  internal/poll.(*pollDesc).prepare
     0.23s  0.64% 94.06%      0.24s  0.67%  runtime.exitsyscallfast
     0.21s  0.58% 94.64%      3.67s 10.19%  runtime.runqgrab
     0.17s  0.47% 95.11%      0.19s  0.53%  runtime.pthread_mutex_unlock
     0.14s  0.39% 95.50%     17.32s 48.10%  runtime.findrunnable
その他の利用方法は「help」を叩いてみてください
(pprof) help
  Commands:
    callgrind        Outputs a graph in callgrind format
    comments         Output all profile comments
    disasm           Output assembly listings annotated with samples
    dot              Outputs a graph in DOT format
    eog              Visualize graph through eog
    evince           Visualize graph through evince
    gif              Outputs a graph image in GIF format
    gv               Visualize graph through gv
    kcachegrind      Visualize report in KCachegrind
    list             Output annotated source for functions matching regexp
    pdf              Outputs a graph in PDF format
    peek             Output callers/callees of functions matching regexp
    png              Outputs a graph image in PNG format
    proto            Outputs the profile in compressed protobuf format
    ps               Outputs a graph in PS format
    raw              Outputs a text representation of the raw profile
    svg              Outputs a graph in SVG format
    tags             Outputs all tags in the profile
    text             Outputs top entries in text form
    top              Outputs top entries in text form
    topproto         Outputs top entries in compressed protobuf format
    traces           Outputs all profile samples in text form
    tree             Outputs a text rendering of call graph
    web              Visualize graph through web browser
    weblist          Display annotated source in a web browser
    o/options        List options and their current values
    quit/exit/^D     Exit pprof

  Options:
    call_tree        Create a context-sensitive call tree
    compact_labels   Show minimal headers
    divide_by        Ratio to divide all samples before visualization
    drop_negative    Ignore negative differences
    edgefraction     Hide edges below <f>*total
    focus            Restricts to samples going through a node matching regexp
    hide             Skips nodes matching regexp
    ignore           Skips paths going through any nodes matching regexp
    mean             Average sample value over first value (count)
    nodecount        Max number of nodes to show
    nodefraction     Hide nodes below <f>*total
    noinlines        Ignore inlines.
    normalize        Scales profile based on the base profile.
    output           Output filename for file-based outputs
    prune_from       Drops any functions below the matched frame.
    relative_percentages Show percentages relative to focused subgraph
    sample_index     Sample value to report (0-based index or name)
    show             Only show nodes matching regexp
    show_from        Drops functions above the highest matched frame.
    source_path      Search path for source files
    tagfocus         Restricts to samples with tags in range or matched by regexp
    taghide          Skip tags matching this regexp
    tagignore        Discard samples with tags in range or matched by regexp
    tagshow          Only consider tags matching this regexp
    trim             Honor nodefraction/edgefraction/nodecount defaults
    trim_path        Path to trim from source paths before search
    unit             Measurement units to display

  Option groups (only set one per group):
    cumulative
      cum              Sort entries based on cumulative weight
      flat             Sort entries based on own weight
    granularity
      addresses        Aggregate at the address level.
      filefunctions    Aggregate at the function level.
      files            Aggregate at the file level.
      functions        Aggregate at the function level.
      lines            Aggregate at the source code line level.
  :   Clear focus/ignore/hide/tagfocus/tagignore

  type "help <cmd|option>" for more information
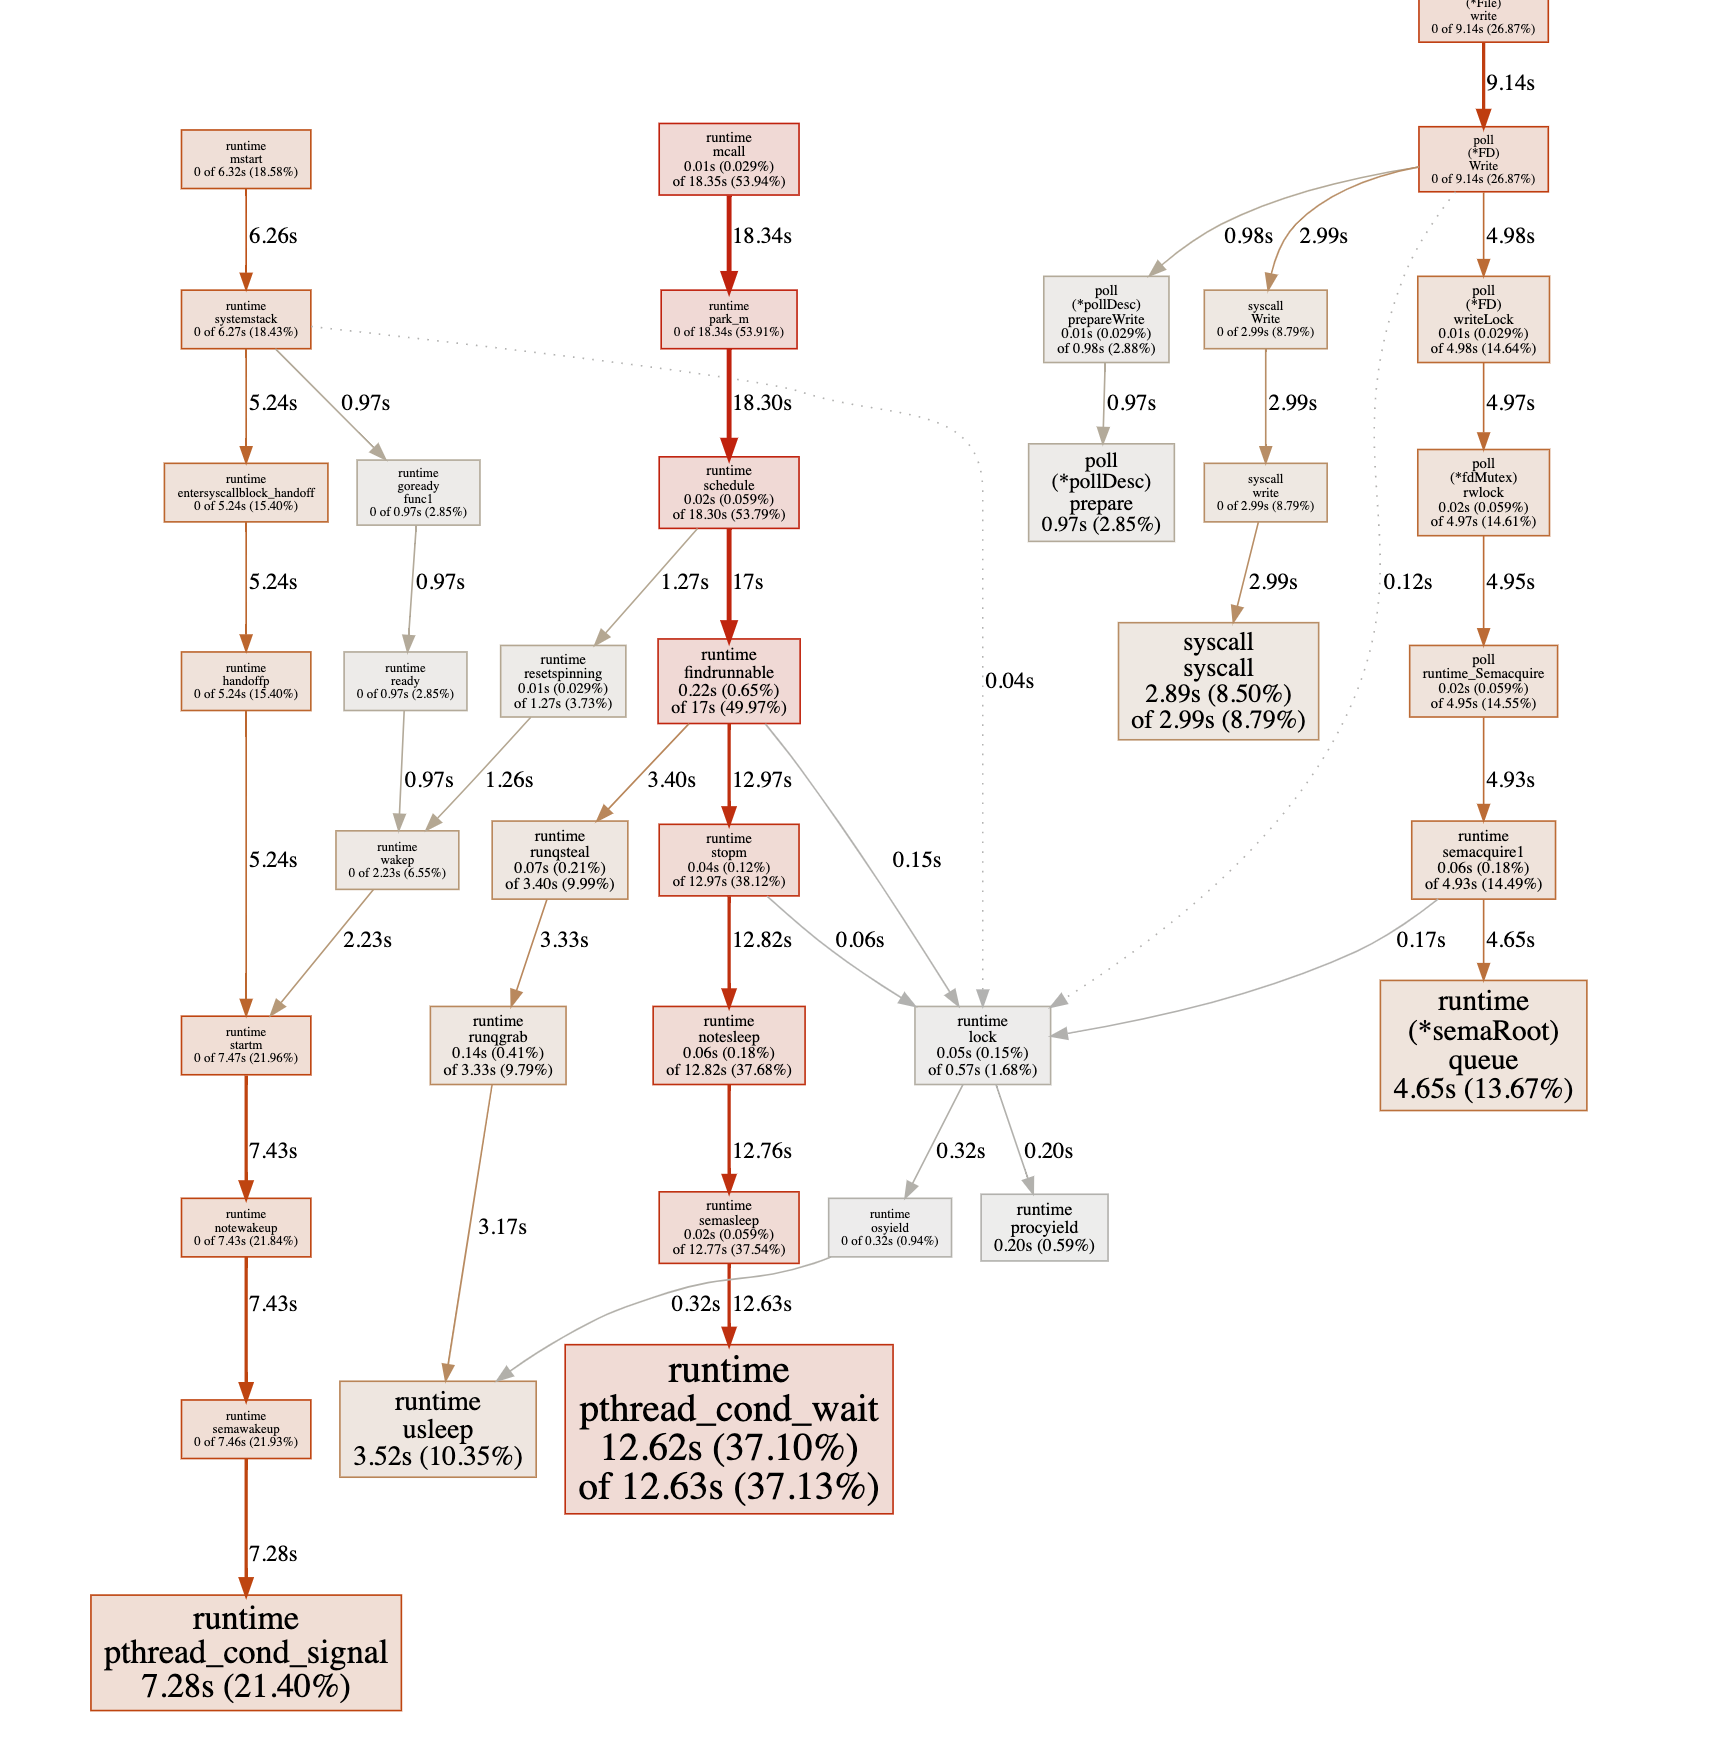
ビジュアライズするのも簡単です。
「web」と打ち込むだけで関数の関係性をビジュアライズしてくれます。
(pprof) web
まとめ
簡単にでしたがpprofのご紹介でした。
何が原因かわからないけどパフォーマンスが出ない、メモリを使い過ぎている際など
ドンドン使っていきたいパッケージのご紹介でした。

shiro seike / せいけ しろう / 清家 史郎
Company:Fusic CO., LTD. Slides:slide.seike460.com blog:blog.seike460.com Program Language:PHP , Go Interest:Full Serverless Architecture